GIIGNL 2026 Report: USLNG Dominance
The Five-Year Rise of USLNG Exports
A Deep Dive into the GIIGNL Data from 2021 to 2025
Compiled by LNG Allies from GIIGNL Annual Reports
The International Group of Liquefied Natural Gas Importers (GIIGNL), founded in 1971 and representing nearly every regasification terminal worldwide, has just released its 2026 Annual Report covering 2025 trade. With it, we finally have a clean, five-year run of data stretching from the start of the post-COVID recovery, as the world reopened, to today. The story that those numbers tell is not subtle. In five years, the United States went from an ambitious LNG upstart to the indispensable supplier at the center of global gas security.
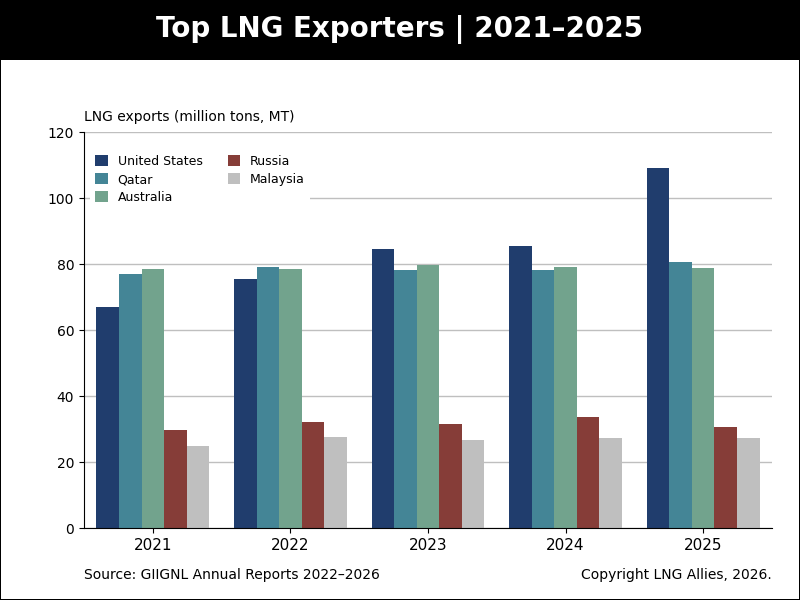
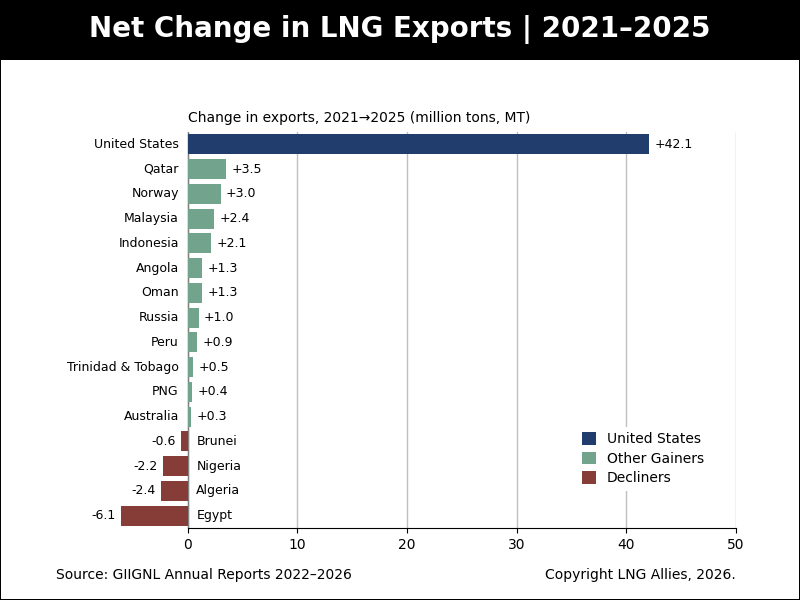
Let’s begin with the headline. Global LNG trade grew from 372 million tons (MT) in 2021 to 428 MT in 2025, a gain of roughly 56 MT, or about 15% over five years. That is healthy, steady growth. But the more remarkable figure sits underneath: the United States supplied the overwhelming majority of the net increase. USLNG exports climbed from 67.0 MT in 2021 to 109.1 MT in 2025, a 42 MT surge that single-handedly accounts for roughly three-quarters of the entire world’s trade growth over the period. The rest of the supply world, in aggregate, barely moved the needle. When people ask where the new molecules came from, the answer is: mostly from the U.S. Gulf Coast.
Europe: From Customer to Anchor Client
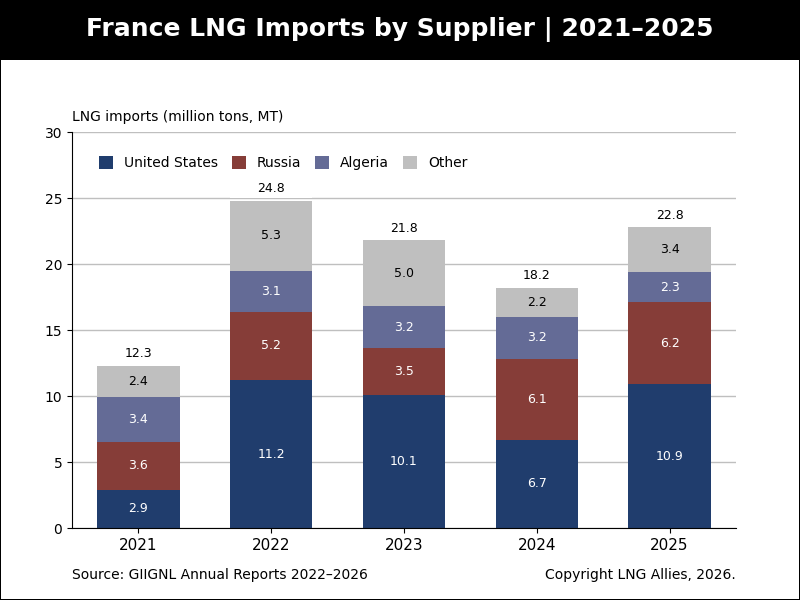
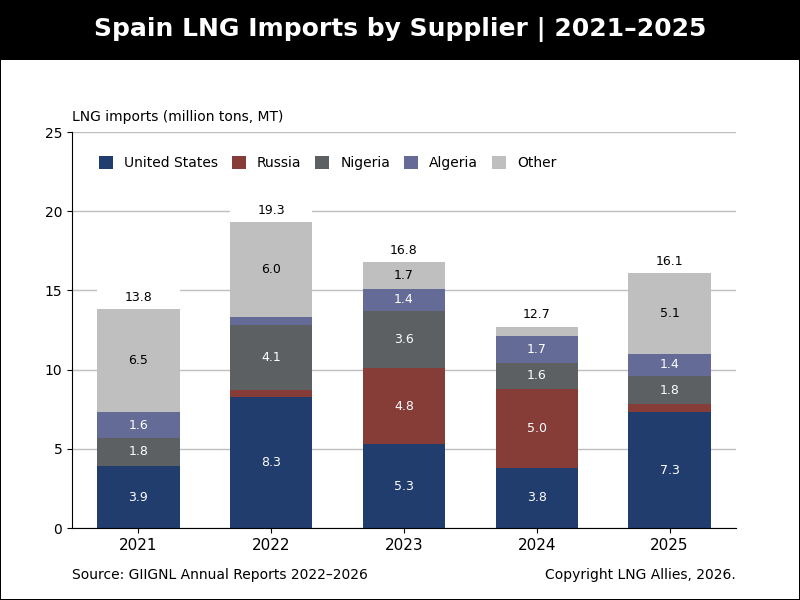
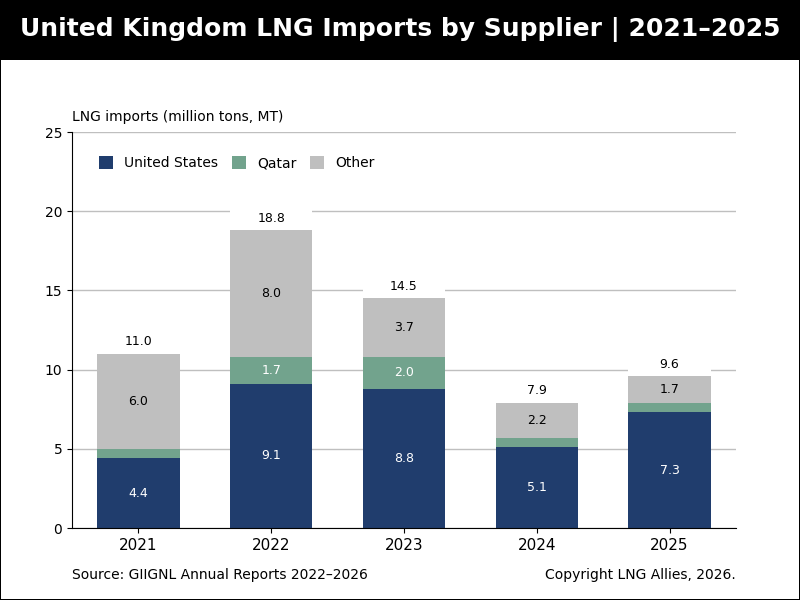
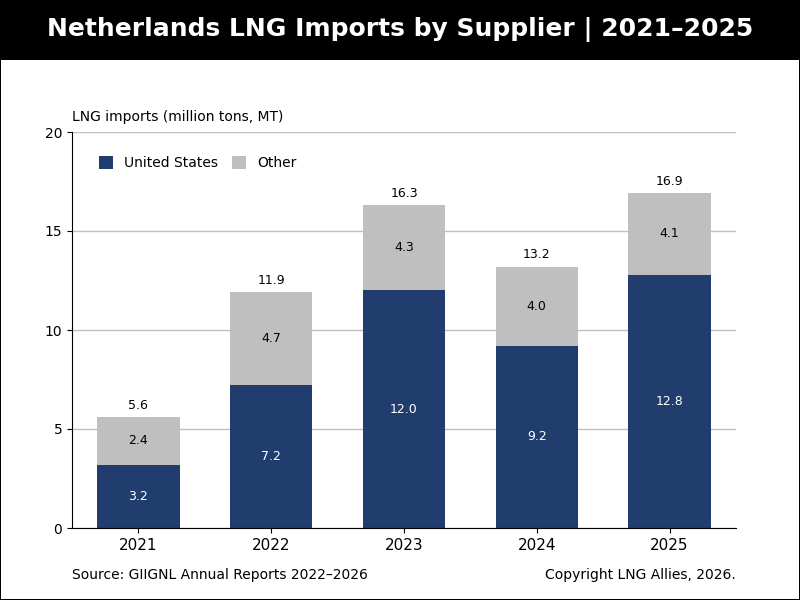
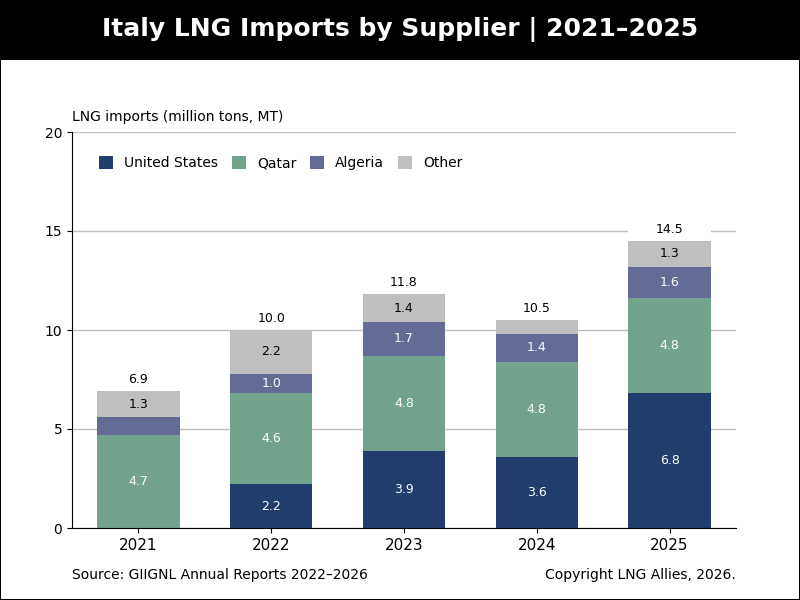
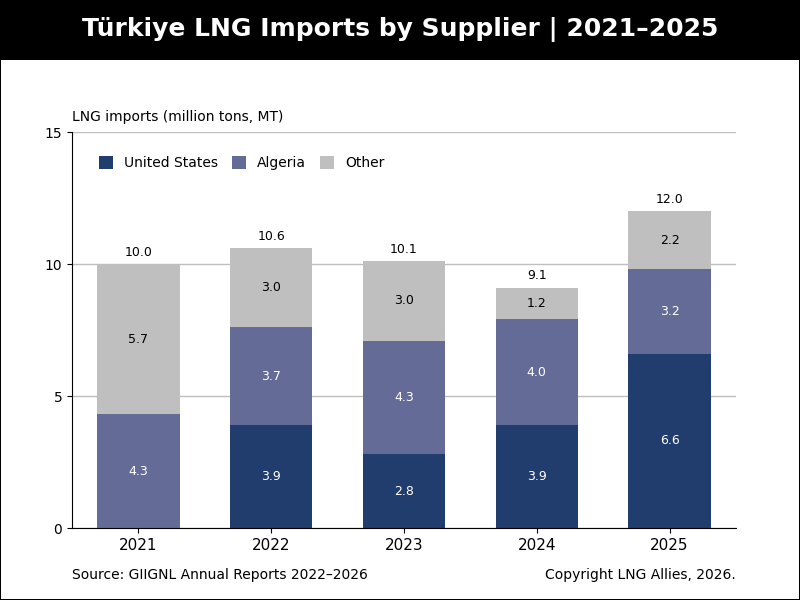
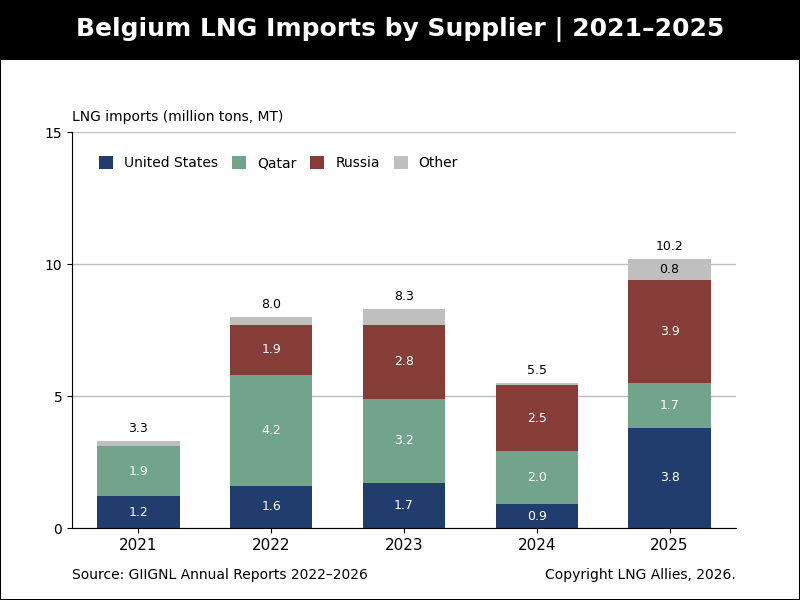
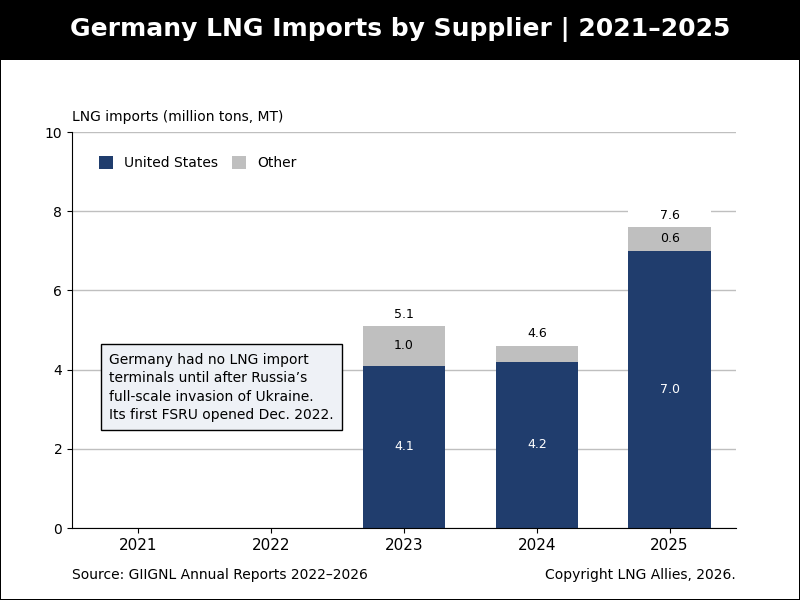
The most consequential shift of the five years was the reorientation of Europe. In 2021, the United States had just become Europe’s leading LNG supplier, sending about 21.5 MT and holding a 29% share of European imports. Europe was still a pipeline economy with an LNG sideline. Then came 2022, Russia’s invasion of Ukraine, and the collapse of Russian pipeline deliveries to Europe. Everything changed. By 2025, USLNG deliveries to Europe had more than tripled to 73.8 MT, a 58% share of the continent’s LNG.
Read that progression slowly: 29%, 43%, 47%, 46%, 58%. The slight (one percentage point) dip in 2024 is instructive and worth being honest about, because it is the kind of nuance that separates analysis from cheerleading. The USLNG share did not fall in 2024 because Europe turned away from America. It fell because total European LNG imports dropped sharply that year, as a mild winter, a nuclear rebound in France, surging renewables, and brimming storage all suppressed demand. USLNG volume fell in absolute terms, but so did all LNG imports. When European demand recovered in 2025, U.S. supply did not just return; it took the largest share the continent has ever seen from a single source. Germany now takes 92% of its LNG from the United States. The Netherlands, 76%. The United Kingdom, 76%. This is now a true, strategic energy partnership.
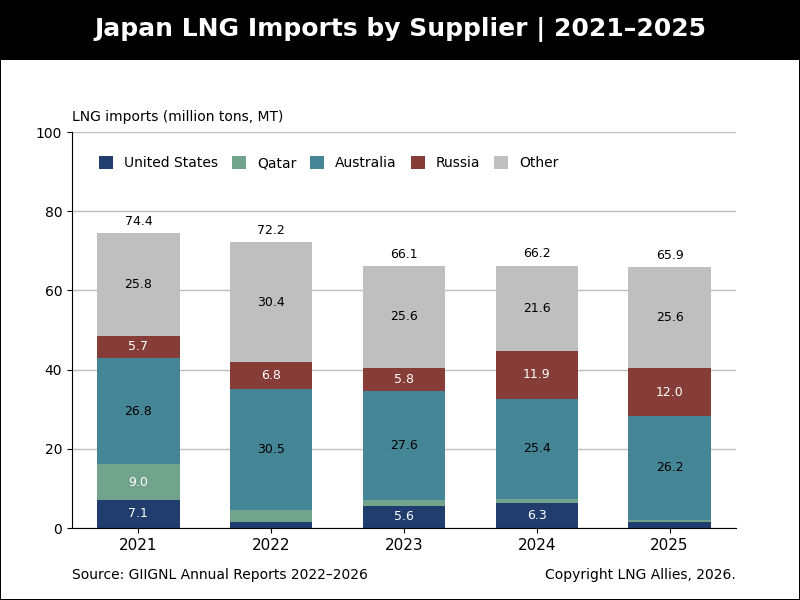
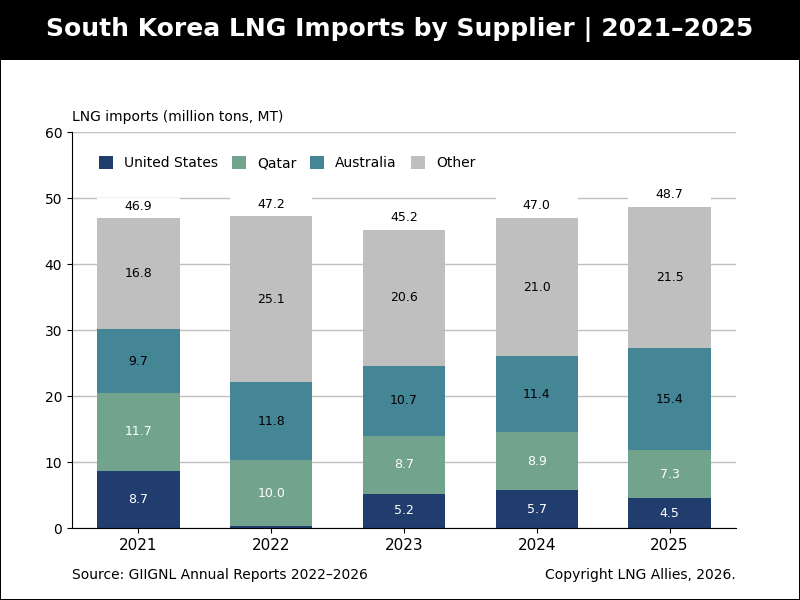
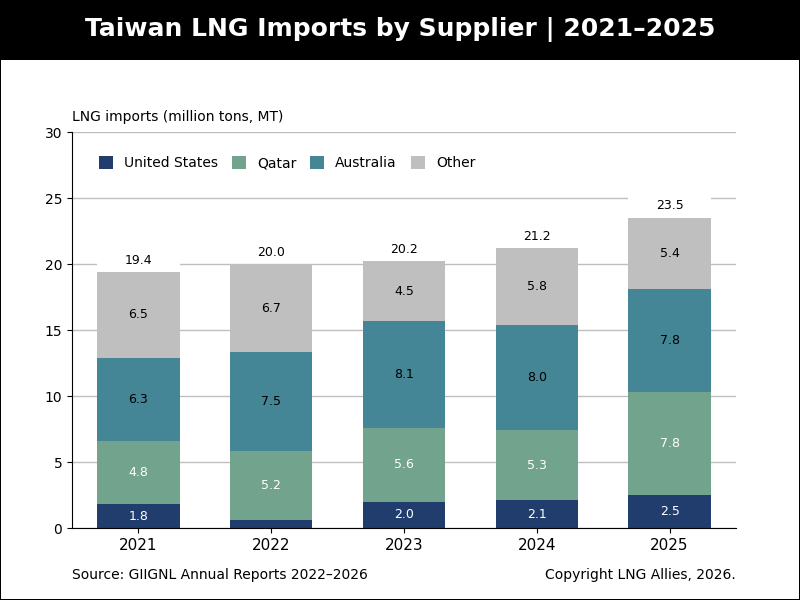
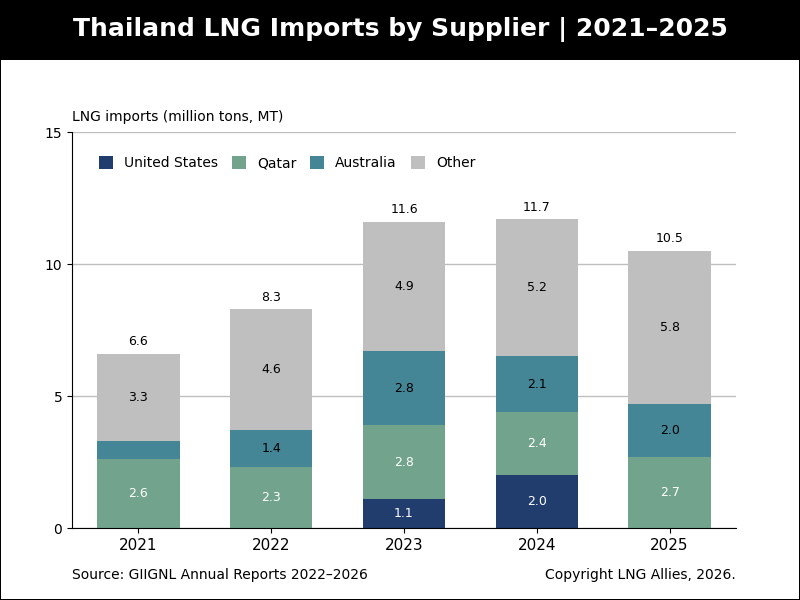
Asia: The Swing Market That Swung Away
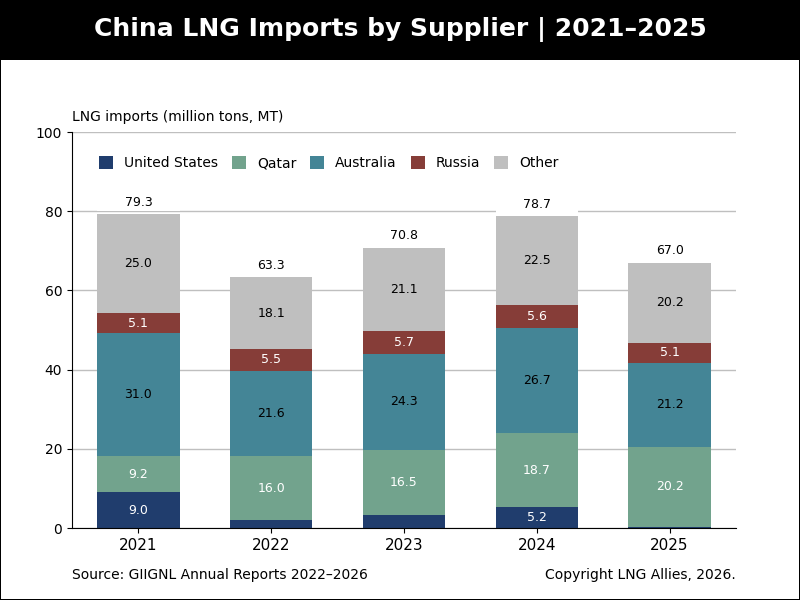
If Europe is the triumphant chapter, Asia is the cautionary one. USLNG exports to Asia were higher in 2021 (32.8 MT) than in 2025 (17.9 MT). The flow reversed because Europe outbid Asia for flexible cargoes during the crisis years, and because trade tensions effectively zeroed out USLNG sales to China (from 9.0 MT in 2021 to 0.3 MT in 2025). But that very reversal is the point. USLNG is not bound to any one region. Its defining feature is flexibility, and it flows to wherever the market pulls hardest. With Middle East supply now exposed to disruption, that pull may well draw American cargoes back toward Asia, or, just as consequentially, bid up the prices that European buyers must pay to keep them in the Atlantic. Either way, the molecules move on commercial logic, and that optionality is itself a strategic asset.
The Build-Out That Made It Possible
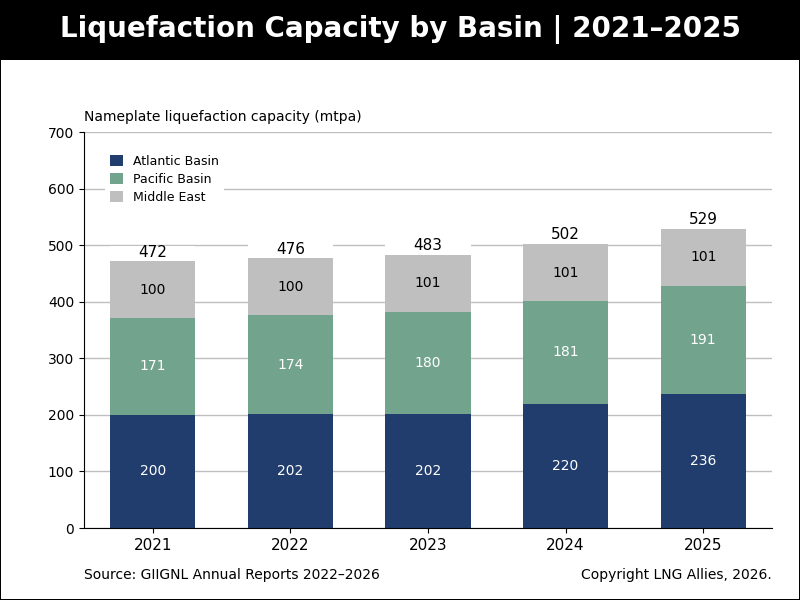
None of this would have been physically possible without steel in the ground. U.S. nameplate liquefaction capacity climbed by roughly 40% from ≈81 mtpa in 2021 to ≈115 mtpa in 2025, pulling the entire Atlantic Basin up with it. That basin grew from 200 to 237 mtpa and is now the world’s largest supply region, displacing the long-dominant Pacific region (Australia, Indonesia, Malaysia, Papua New Guinea). Global capacity rose from 462 to 524 mtpa over the period, and the United States provided the lion’s share of the additions: Calcasieu Pass, Corpus Christi Stage 3, and the Plaquemines ramp were the marginal molecules the world leaned on.
The contracting record underlines the momentum, with one telling interruption. The post-2022 security panic drove a record wave of long-term deals, roughly 81 mtpa committed in 2022 at the longest average durations ever recorded, and the buying continued into 2023 with 47 long-term SPAs signed globally. Then came 2024 and the Biden administration’s “pause” on non-FTA export authorizations. New U.S. commitments stalled and not a single USLNG project reached a final investment decision: zero U.S. FIDs that year. The chilling effect was real and measurable. And then 2025 roared back, five U.S. FIDs totaling some 54.5 mtpa, the strongest year of the cycle, as policy clarity returned speedily under the second Trump administration and buyers signed 83 long-term SPAs globally, with USLNG project developers accounting for the dominant share of seller-side activity. That sequence (boom, regulatory freeze, rebound) is the single best piece of evidence that authorization durability is not a bureaucratic footnote. It is the throttle on the whole system.
Why It Still Matters: The Security Premium
The final piece of the five-year picture is the one the importers’ own analysts now emphasize: vulnerability. GIIGNL’s latest report models a Strait of Hormuz disruption removing roughly 20% of global LNG supply, a scenario that turned from hypothetical to urgent with the March 2026 Ras Laffan strikes. In that world, the Atlantic Basin is the only large-scale alternative to Hormuz-dependent Middle East supply, and the United States is its anchor. European storage, meanwhile, has entered structural deficit, ending the last two winters only 34% and 29% full rather than the comfortable 60s, even as Russian transit through Ukraine fell to effectively zero.
Put the five years together and the throughline is unmistakable. Demand is growing, the non-USA alternatives are concentrated in a chokepoint, Europe has rebuilt its energy security on a USLNG foundation, and Asia is the open frontier. The data, compiled by the buyers themselves, makes the seller’s case crystal clear. The molecules tell the story—and for five straight years, they have been speaking with an American accent.