![[USLNG Logo]](https://lngallies.com/wp-content/themes/lng-allies/assets/images/lng-logo-2026.png)
U.S. Jobs and Growth
USLNG exports support jobs and national economic growth.
At a Glance
- A Dec. 2024 S&P Global study led by Daniel Yergin projects USLNG exports will support nearly 500,000 American jobs annually and contribute $1.3 trillion to U.S. GDP through 2040.
- USLNG exports have already contributed more than $400 billion to U.S. GDP and supported hundreds of thousands of jobs since 2016.
- A decade of operating history has disproved every prediction that USLNG exports would drive up domestic prices. Henry Hub averaged $2.28/mmbtu in 2024—near a historic low—while America was simultaneously the world’s largest LNG exporter.
- Growing USLNG exports will have negligible impact on domestic gas prices. U.S. prices remain among the lowest in the developed world.
The Definitive Study
In Dec. 2024, S&P Global published the definitive analysis of USLNG exports and their impact on the American economy: Major New U.S. Industry at a Crossroads: A U.S. LNG Impact Study, led by Daniel Yergin, S&P Global Vice Chairman and the world’s foremost energy economist.
The headline findings: growing USLNG exports will support nearly 500,000 American jobs annually and contribute $1.3 trillion to U.S. GDP through 2040, while having negligible impact on domestic gas prices. Future export activity will generate more than $2.5 trillion in total revenues for U.S. businesses, $166 billion in federal and state tax revenues, and $500 billion+ in labor income.
As Yergin put it: “The emergence of the USLNG industry has placed the United States in the pole position with global demand for gas expected to grow through 2040 alongside the rapid growth of renewables. It was USLNG that replaced nearly half of Russia’s gas supply to Europe after the outbreak of war in Ukraine.”
The timing matters. The study was published Dec. 17, 2024, the same day the outgoing Biden administration released its own study with a cover letter from then DOE Sec. Jennifer Granholm arguing that USLNG exports would harm U.S. consumers. The two studies reached different conclusions but, in our view, the S&P Global analysis is the more comprehensive and credible of the two.
The Abundance Argument
USLNG exports currently represent ≈16% of U.S. dry natural gas production—a share that is growing but remains a fraction of an extraordinarily deep resource base. The United States is the world’s largest producer, with proven reserves growing year after year. Since exports began in 2016, U.S. production has consistently outpaced both domestic consumption growth and export growth. The market has responded to export demand not by depleting domestic supply, but by producing more. EIA projects U.S. dry gas production will reach record highs in 2026 and 2027, driven substantially by LNG export demand itself. That is how competitive markets work.
What History Actually Shows on Domestic Prices
Critics of USLNG exports have warned for a decade that growing exports would drive up domestic gas prices, harming American households, manufacturers, and industrial energy consumers. The Industrial Energy Consumers of America and similar organizations have made this argument persistently since the first export authorization was filed. The Chicken Littles weren’t just wrong… They were never right.
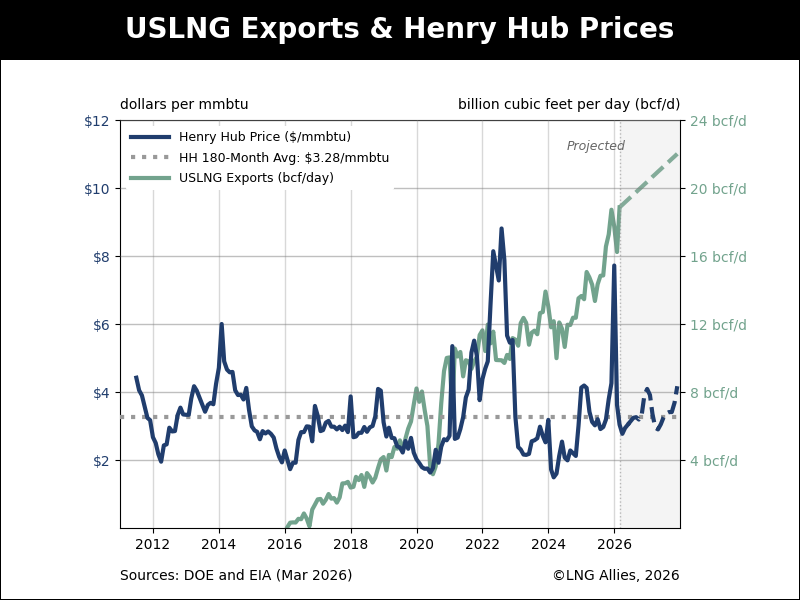
The historical record is the definitive rebuttal. Here is what actually happened to Henry Hub spot prices while USLNG exports grew from zero to world-leading:
| Year | Henry Hub (avg.) | Context |
|---|---|---|
| 2016 | $2.62/mmbtu | First cargo sails Feb. 24; 0.5 bcf/d exported. Critics predict price spike. It doesn’t happen. |
| 2017 | $3.02/mmbtu | Cove Point (Md.) ships first cargo; exports ≈1.0 bcf/d. Modest price rise on supply tightness—not exports. |
| 2018 | $3.15/mmbtu | Cameron, Corpus Christi, Freeport under construction. Exports reach 3.0 bcf/d. Prices barely move. |
| 2019 | $2.57/mmbtu | New terminals ramp up; exports 5.0 bcf/d. Prices fall. Shale absorbs export demand without strain. |
| 2020 | $2.03/mmbtu | COVID collapses demand. Lowest HH annual avg. since 1997. Cargoes cancelled mid-voyage. Market safety valve works as designed. |
| 2021 | $3.89/mmbtu | Post-pandemic surge. ttf +268%, JKM +113%. HH +91%—but still a fraction of global benchmarks. |
| 2022 | $6.45/mmbtu | Russia invades Ukraine. Global supply shock drives HH to 14-year high. Not export policy. Even so, HH is a fraction of European prices. |
| 2023 | $2.53/mmbtu | War premium evaporates. Record production pushes prices below pre-export norms. Biden pauses exports Jan. 2024—at a 30-year real-price low. |
| 2024 | $2.19/mmbtu | U.S. now world’s largest LNG exporter. HH hits lowest annual avg. on record. The Chicken Littles are not apologizing. |
| 2025 | $3.52/mmbtu | Record exports of 15.0 bcf/d; Plaquemines and Corpus Christi expansion online. Prices rise on demand growth—still below ttf and JKM, still among the lowest in the developed world. |
| Source: EIA / FRED, Federal Reserve Bank of St. Louis. Annual averages, nominal dollars. | ||
The pattern is unmistakable. Through ten years of explosive USLNG export growth, domestic prices fell more often than they rose. When they did spike sharply in 2022, the driver was a global supply disruption caused by Russia’s invasion of Ukraine—not American export policy. U.S. prices in 2024 were lower in nominal terms than in the year the first cargo sailed.
LNG Allies commissioned two independent analyses of the domestic price question from R. Dean Foreman, Ph.D., former chief economist of the American Petroleum Institute and chief economist of the Texas Oil & Gas Association. Both studies reached the same conclusion. Foreman’s May 2023 analysis found that exports are “only one of myriad market factors that can drive domestic natural gas prices” and that the resource base and production growth are far more significant determinants. His Feb. 2024 update—published the same week the Biden administration announced its export pause—found that USLNG exports had “not had any sustained and significant direct impact on U.S. natural gas prices,” and that Henry Hub had hit its lowest real price in 30 years at $1.70/mmbtu in early Feb. 2024 while exports were near record highs.
As TXOGA President Todd Staples summarized: “Data confirm LNG exports have had no impact on domestic natural gas prices. In fact, the real price of natural gas in America hit its lowest point in 30 years in mid-February while our LNG exports have neared record highs.”
The legitimate version of the price concern is narrower: rapid export expansion combined with domestic demand spikes and infrastructure bottlenecks could create localized, temporary price pressure. The answer is more production and better pipeline infrastructure—not export restrictions.
The Jobs Are Real
USLNG exports support a broad, geographically distributed base of American employment, from wellhead to waterfront: upstream production workers in Pa., Texas, La., W.Va., and Ohio; construction and manufacturing workers building LNG export terminals along the Gulf Coast; engineers and technical specialists at Chart Industries, Baker Hughes, Air Products, Bechtel, GE Vernova, and others; maritime workers and port operators; and legal, financial, and professional services workers in Houston, WDC, and NYC. From 2016 through 2024, more than 75% of private USLNG capital expenditure focused on expanding upstream, pipeline, and liquefaction infrastructure, with over half flowing directly to construction and manufacturing.
The Trade Balance Benefit
USLNG is one of America’s most valuable and fastest-growing export categories—and one of the very few where gross export value and net trade surplus are essentially the same number. For a full analysis, see America’s Export Powerhouse.
To discuss how USLNG exports benefit the American economy, connect with LNG Allies President Fred Hutchison on LinkedIn.
Selected References
- EIA. Short-Term Energy Outlook: Natural Gas. EIA, April 2026.
- EIA. AEO2026: Domestic and International Demand Drive Natural Gas Production Growth. EIA, April 2026.
- RFF. Unpacking the DOE’s Report on U.S. LNG Exports. Resources for the Future, March 2025.
- Baker Institute/Medlock, K. U.S. LNG Exports: Truth and Consequence Revisited. Baker Institute, Feb. 2025.
- Yergin, D., et al. Crossroads: USLNG Impact Study. S&P Global, Dec. 2024.
- DOE/OnLocation. Energy, Economic, and Environmental Assessment of U.S. LNG Exports. DOE, Dec. 2024.
- Foreman, R.D. USLNG Exports and Domestic Prices: Updated Analysis. LNG Allies/TXOGA, Feb. 2024.
- Foreman, R.D. USLNG Exports and Domestic Prices. LNG Allies, May 2023.