![[USLNG Logo]](https://lngallies.com/wp-content/themes/lng-allies/assets/images/lng-logo-2026.png)
America’s Export Powerhouse
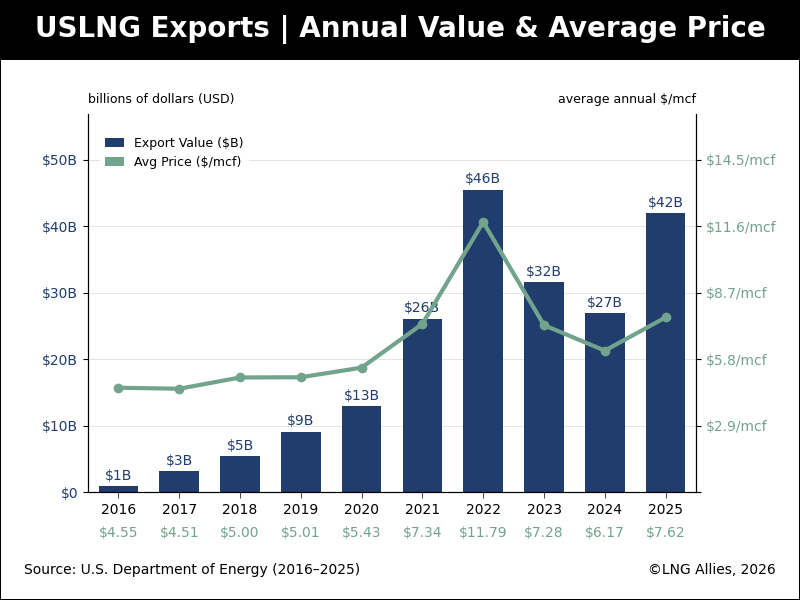
In 2024 USLNG exports were valued at $27 billion rising to $42 billion in 2025. An amazing ten year exports trade success.

At a Glance
- In 2025, USLNG exports generated $42 billion in export revenue—more than Hollywood’s entire global film and television exports in the same year.
- On a net trade balance basis, USLNG is one of the very few American export categories where gross export value and net surplus are essentially the same number.
- The United States went from zero USLNG exports to the world’s largest LNG exporter in less than a decade—the fastest ramp in the history of the global energy trade.
- Record 2025 export volumes were driven entirely by new capacity coming online, not elevated prices—demonstrating that USLNG’s growth is structural, not cyclical.
By Fred H. Hutchison
When Americans think about U.S. export products, they think of Boeing jets, Silicon Valley chips, Hollywood films, or soybeans from the Midwest. Almost no one thinks about liquefied natural gas… but they should.
In 2024, USLNG exports generated $27 billion in export revenue—and that number grew to $42 billion in 2025. By comparison, Hollywood’s entire film and television exports earned an estimated $22 billion in each of those two years. That $27 billion from USLNG in 2024 also ranked above wheat and corn exports, above dairy, livestock, and poultry. At $27 billion, USLNG exceeded American soybean exports of $24.6 billion, long considered the crown jewel of U.S. agricultural trade.
Unlike autos, steel, or pharmaceuticals—which run significant net trade deficits—USLNG has gross export value and net traded value of essentially the same number.
The United States imports negligible LNG by vessel. The one exception is instructive: the Everett terminal outside Boston receives occasional LNG cargoes to meet New England’s winter peak demand that cannot be met by domestic pipeline gas due to regional infrastructure constraints. The cruel irony is that those cargoes typically come from overseas suppliers because the Jones Act requires waterborne cargo between U.S. ports to be carried on vessels that are U.S. owned, built, flagged, and crewed—and no Jones Act-compliant LNG carriers currently exist. The result is that one of the world’s largest natural gas producers must occasionally import gas to serve its own Northeast market.
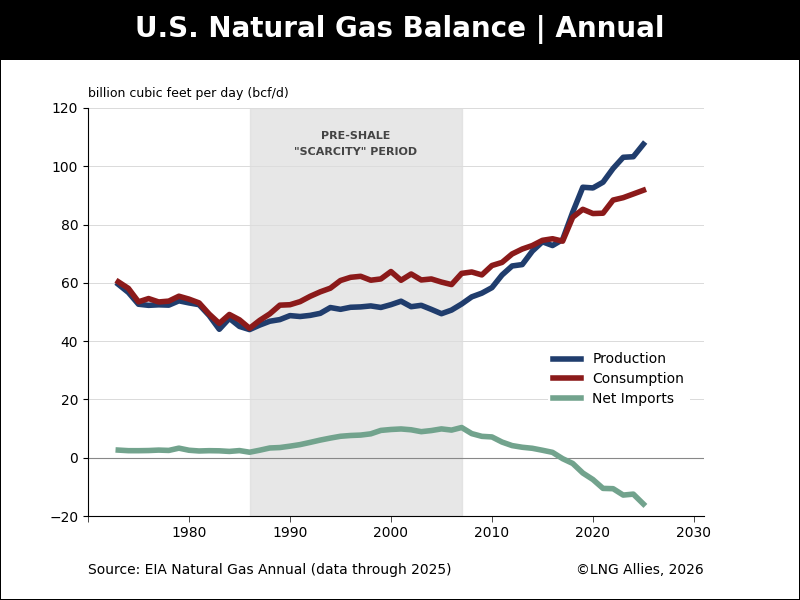
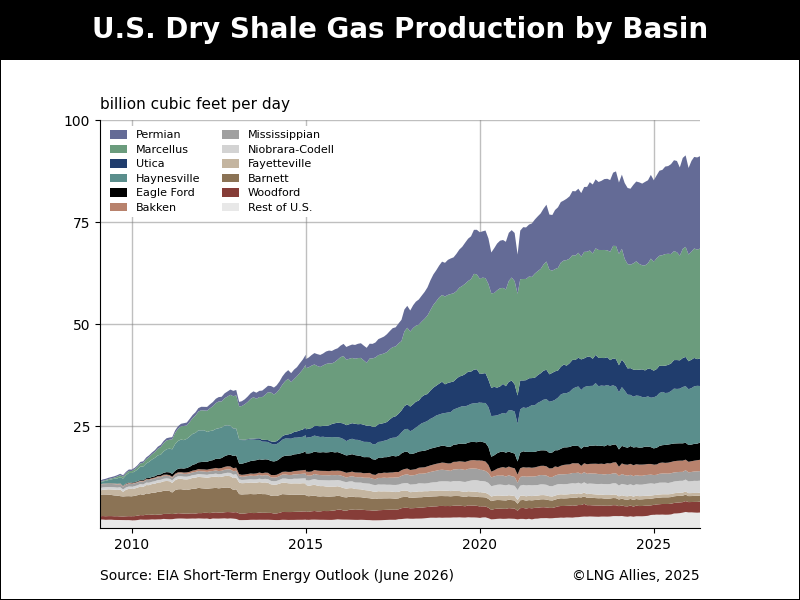
What makes the USLNG export story even more remarkable is its timeline. The first USLNG cargo of the modern era left Sabine Pass, Louisiana, on February 24, 2016—a little over a decade ago. At the time, the United States had been a net natural gas importer for decades. The import terminals now lining the U.S. Gulf Coast were originally built to receive LNG from overseas, not send it abroad. The shale revolution changed everything, flooding the country with cheap, abundant natural gas that had nowhere to go… until it did.
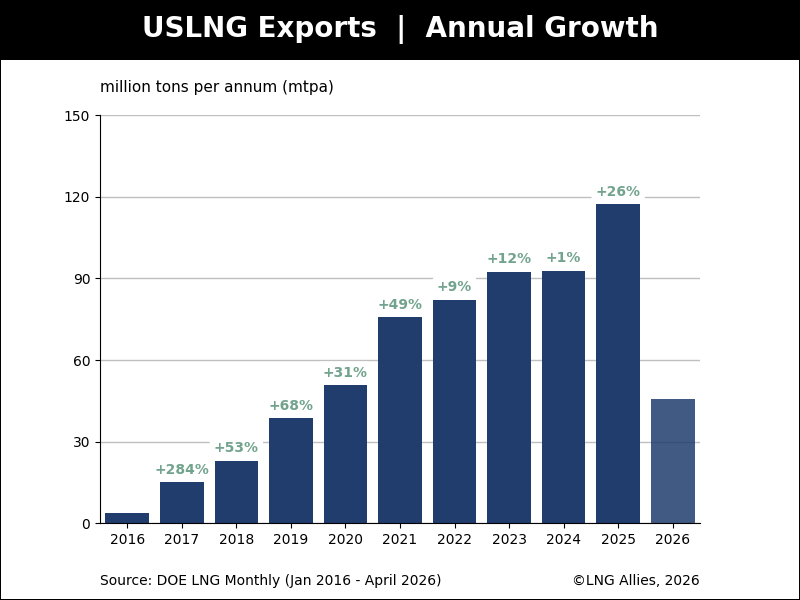
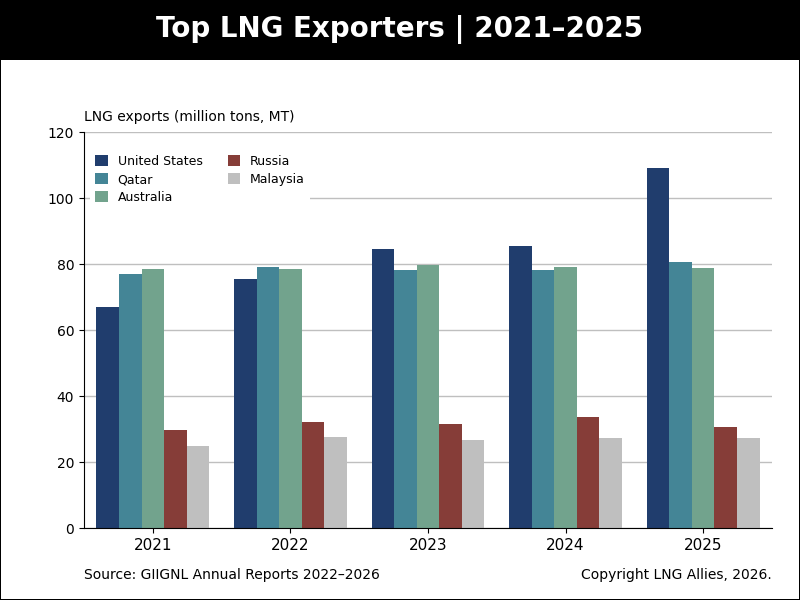
By 2023, the United States had surpassed Qatar and Australia to become the world’s largest LNG exporter. In 2024—the most recent year for which comparative export data is available—volumes and values held roughly steady, as no new liquefaction capacity entered service in either 2023 or 2024.
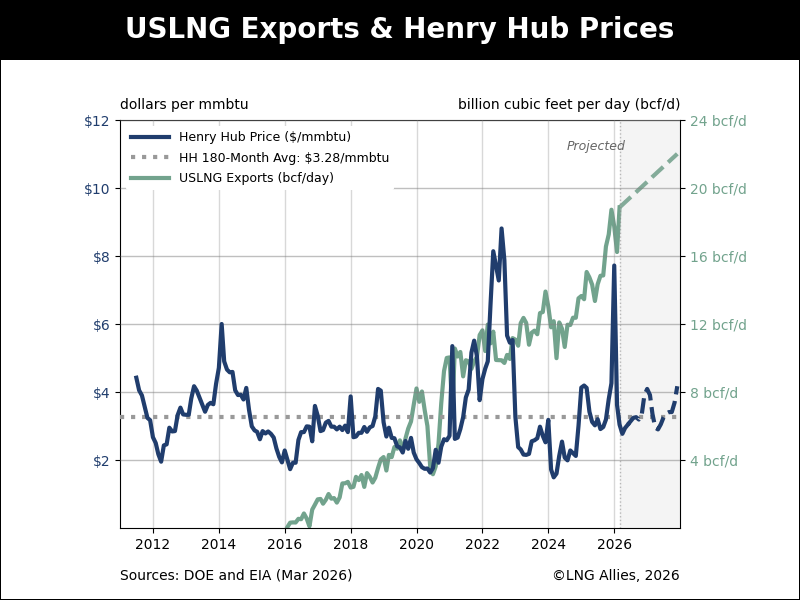
But 2025 brought record export volumes, driven by new capacity coming online, reaching 5.51 trillion cubic feet of USLNG exports. The resulting $42 billion was not driven by elevated prices: declared export values averaged $7.62 per MMBtu in 2025, well below the 2022 peak of $11.79 per MMBtu. The jump was driven entirely by new capacity. And despite record export volumes, domestic consumers have not paid a premium: Henry Hub averaged just $3.52 per MMBtu in 2025, well within historical norms.
To put USLNG’s position in the U.S. export landscape in perspective, consider two rankings. On a gross export value basis, USLNG in 2024 sat eighth among major export categories—a remarkable position for an industry less than a decade old. But the gross ranking understates the real story.
| Rank | Category | Gross Value | Source |
|---|---|---|---|
| 01 | Chemicals (excl. pharma)* | $229B | SelectUSA / American Chemistry Council |
| 02 | Aircraft & Aerospace | $134B | UN COMTRADE / AIA |
| 03 | Crude Oil & Petroleum | $118B | U.S. Census Bureau |
| 04 | Pharmaceuticals & Medical Equip. | $94B | UN COMTRADE |
| 05 | Semiconductors | $70B | U.S. Bureau of Labor Statistics |
| 06 | Automobiles | $59B | U.S. Census Bureau |
| 07 | Dairy, Livestock & Poultry | $36B | USDA Foreign Agricultural Service |
| 08 | USLNG Exports | $27B | U.S. Department of Energy |
| 09 | Soybeans | $25B | USDA FAS |
| 10 | Film & Television | $22B | Motion Picture Association of America |
| 11 | Steel | $20B | U.S. Census Bureau / AISI |
| 12 | Corn | $14B | USDA FAS |
| 13 | Wheat | $6B | USDA FAS |
| USLNG 2025 export value rose to $42 billion on record volumes of 5,507 billion cubic feet exported. * Includes plastics and resins. | |||
When you apply a net trade balance lens—exports minus imports—the picture shifts dramatically. Autos flip from a $59 billion gross export to a $158 billion net deficit. Pharmaceuticals, despite $94 billion in gross exports, run an even larger net deficit because the United States imports approximately $234 billion in drugs annually, most manufactured in Ireland, Switzerland, and Germany. Steel is also net negative. Crude oil and petroleum products are roughly breakeven because the United States exports significant volumes but imports different grades to supply its refineries.
USLNG, by contrast, is one of the very few categories in American trade where gross export value and net trade surplus are essentially the same number. On a net basis, only aerospace ($98 billion surplus) and semiconductors ($47 billion surplus) clearly outrank it among the categories we examined. That makes USLNG exceptionally rare in the context of a nation that ran a $918 billion goods and services trade deficit in 2024.
| Rank | Category | Net Balance | Basis |
|---|---|---|---|
| 01 | Chemicals (excl. pharma)* | +$100B | Estimated; large offsetting imports |
| 02 | Aircraft & Aerospace | +$98B | $134B exports / $36B imports |
| 03 | Semiconductors | +$47B | $70B exports / $23B imports |
| 04 | USLNG Exports | +$27B | Net = Gross; negligible imports |
| 05 | Soybeans | +$25B | Negligible imports |
| 06 | Film & Television | +$22B | Net exporter; positive balance |
| 07 | Corn | +$14B | Negligible imports |
| 08 | Wheat | +$6B | Negligible imports |
| 09 | Dairy, Livestock & Poultry | Positive | Net exporter |
| 10 | Crude Oil & Petroleum | Breakeven | Net exporter by volume; neutral by value |
| — | Pharmaceuticals & Medical Equip. | Deficit | $94B exports / $234B imports |
| — | Steel | -$6B | $20B exports / $26B imports |
| — | Automobiles | -$158B | $59B exports / $217B imports |
| USLNG 2025 net surplus rose to approximately $42 billion. * Includes plastics and resins. All net figures are approximations based on available 2024 trade data. Broad sector categories may include overlapping subcategories. | |||
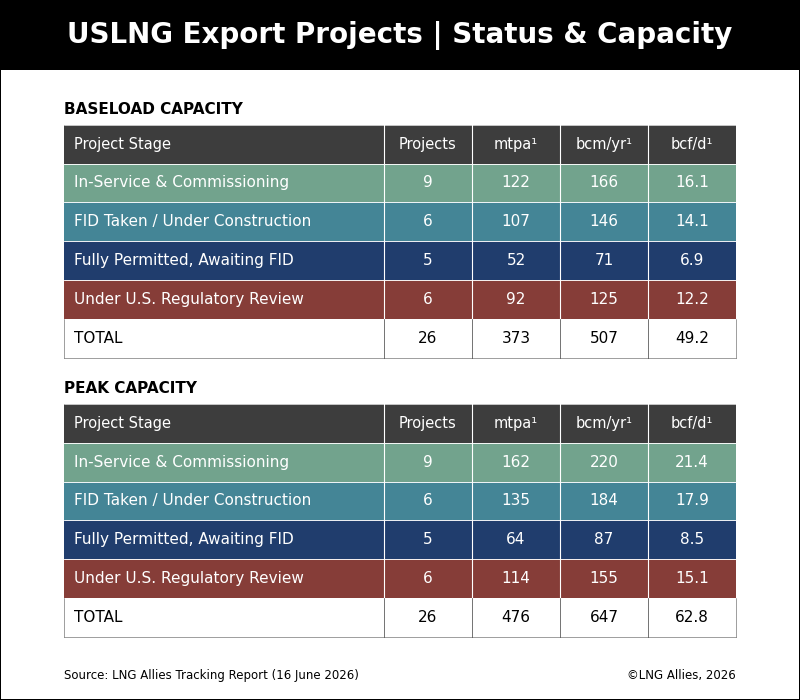
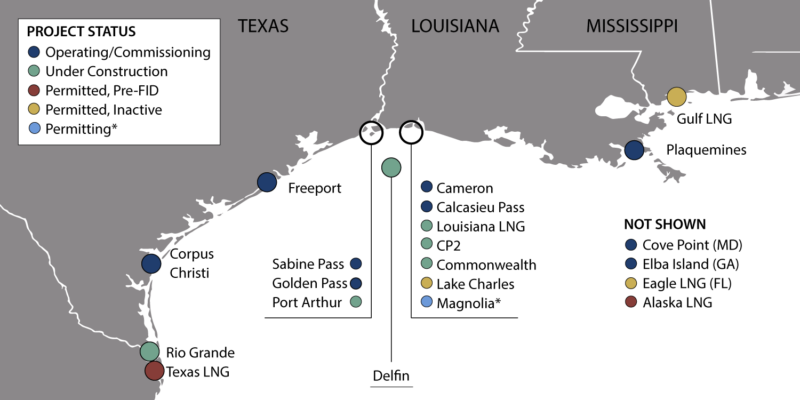
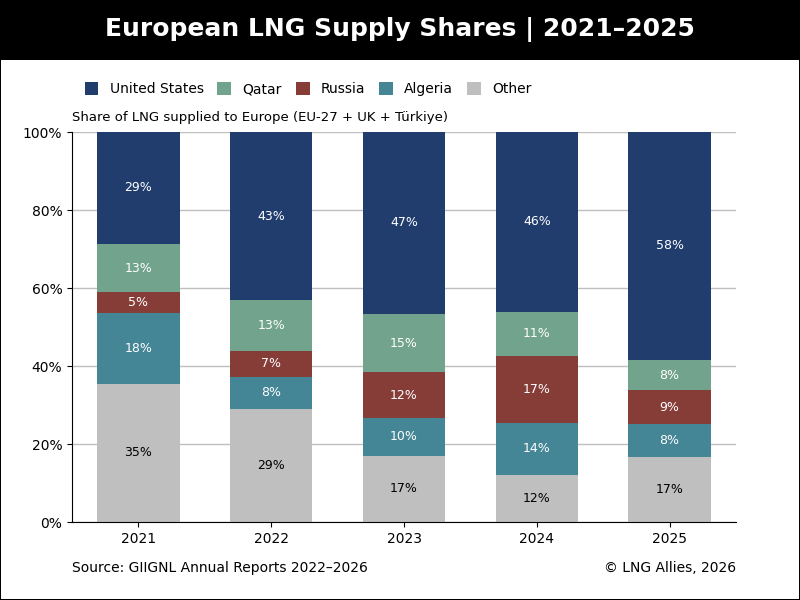
The geopolitical dimensions reinforce the economic ones. USLNG has become a cornerstone of European energy security in the wake of Russia’s invasion of Ukraine, and has deepened trade relationships with Japan, South Korea, India, and new emerging markets. The pipeline of projects now under construction—Rio Grande, Port Arthur, CP2, Louisiana LNG, Commonwealth, and Delfin among them—points to a second decade of growth that will dwarf the first.
Ten years. Zero to $42 billion. Larger than Hollywood, corn, and wheat combined. That is the USLNG story, and it is only getting going.
To discuss USLNG’s role in the American economy and global trade, connect with LNG Allies President Fred Hutchison on LinkedIn.
Selected References
- DOE. LNG Annual Report 2025. U.S. Department of Energy, 2026.
- EIA. U.S. Natural Gas Exports to Grow Nearly 30% by 2027 as LNG Facilities Ramp Up. U.S. Energy Information Administration, April 2026.
- EIA. The United States Remained the World’s Largest Liquefied Natural Gas Exporter in 2024. U.S. Energy Information Administration, February 2025.
- Yergin, D., et al. Crossroads: USLNG Impact Study. S&P Global, December 2024.
- Motion Picture Association. 2024 THEME Report. Motion Picture Association, 2024.
- USDA. Global Agricultural Trade System. USDA Foreign Agricultural Service, 2024.
- U.S. Census Bureau. U.S. Trade in Goods by Category. U.S. Census Bureau, 2024.
Additional Charts